Published by November 9, 2025 · Reading time 23 minutes · Created by Lix.so
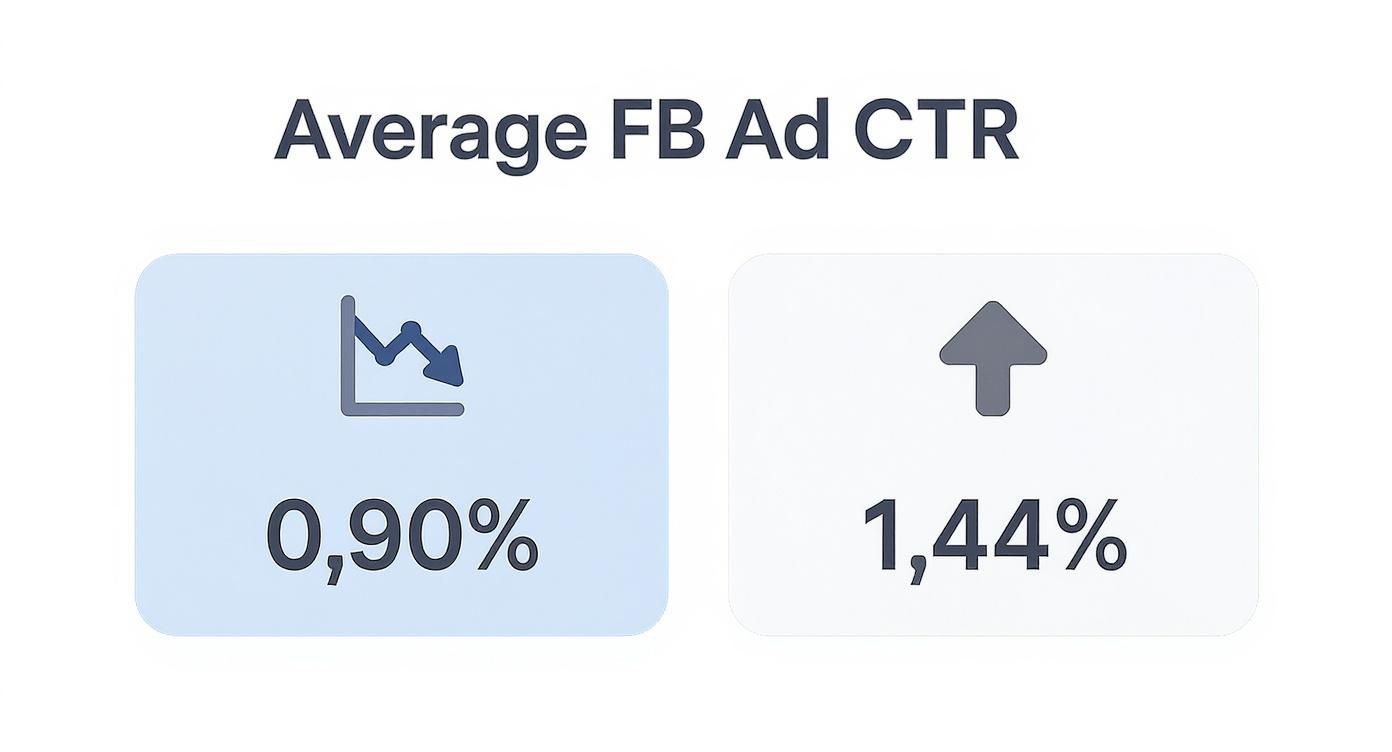
Right off the bat, we need to talk about benchmarks. Across the board, you can expect the average Facebook ad click-through rate to land somewhere between 0.90% and 1.44%. But let's be clear: that platform-wide average is just a signpost, not the destination. A "good" CTR is tangled up in your specific industry, the creative you're running, and what you’re trying to achieve.
Think of your Click-Through Rate (CTR) as the most immediate health check for your Facebook ads. Simply put, it’s the percentage of people who saw your ad and actually felt compelled to click on it.
Imagine your ad is a digital billboard on a ridiculously busy highway. Your impression count is how many cars drive past. Your CTR is the percentage of drivers who saw your message, thought, "Huh, that's for me," and actually took the exit.
This metric is a raw, unfiltered look at your ad's relevance. A high CTR is a great sign; it tells you that your creative, your copy, and your targeting are all clicking with your audience. A low CTR, on the other hand, is a red flag signaling a disconnect. Your message just isn't hitting home. Getting a feel for this relationship is the first real step toward figuring out what’s working and what needs fixing.
It's so tempting to get fixated on a single "magic number," but a good CTR isn't a one-size-fits-all deal. The reality is much messier. For instance, an e-commerce brand dropping a hot new product might easily pull a 2.5% CTR and feel pretty good about it. Meanwhile, a B2B company advertising enterprise software might be thrilled with a 0.7% CTR because the value of that single click is massive.
This huge variation comes down to a few key factors:
A strong CTR isn’t about hitting some universal benchmark. It’s about understanding what that number says about your ad's connection with your target audience. It’s the very first signal that you’ve successfully stopped the scroll.
Recent data really drives home how much these numbers can swing. Over the past couple of years, major industry reports consistently place the average CTR for Facebook ads between 0.90% and 1.44% on a global scale. This range shows that while there's a general baseline, performance is always in flux, shaped by the unique context of every single campaign. If you want to dive deeper into the numbers, you can explore detailed Facebook advertising stats here.
Trying to judge your Facebook ad performance in a vacuum is like checking your car's mileage without knowing if you're driving a hybrid or a monster truck. A single, platform-wide average for click-through rate just doesn't tell you much. To really know if your ads are landing, you have to benchmark them against your direct competition.
The truth is, the average Facebook ad click-through rate can swing wildly from one industry to another. Industries that are highly visual and drive impulse buys almost always see more clicks. Just think about your own feed—you're far more likely to tap on an ad for a cool pair of sneakers or a gorgeous travel destination than one for B2B software or financial planning.
This chart gives you a good sense of the general CTR range you'll find on the platform, showing the difference between lower- and higher-performing sectors.
As you can see, the spectrum is broad. Some industries struggle to get past 1%, while others consistently fly past 1.4%. Figuring out where your business fits is the first step toward setting performance goals that are actually achievable.
Dig into the data, and a clear pattern shows up. Industries that lean on compelling visuals and forge an instant emotional connection tend to lead the pack. These are usually your B2C sectors, where the path to purchase is shorter and more spontaneous.
On the flip side, industries with longer sales cycles, bigger price tags, or less "exciting" products naturally have more modest CTRs. A 0.8% CTR for a B2B SaaS company might actually be a huge win, signaling that you're reaching a very specific, high-value audience. But that same 0.8% for a hot new fashion brand? That could be a red flag that your creative just isn't cutting it.
The goal isn't just to get any clicks; it's to get the right clicks. A lower CTR from a perfectly targeted audience is almost always more valuable than a high CTR from a crowd that will never buy.
The latest data from March 2023 backs this up, showing a clear divide. The apparel and footwear sector was a global leader with an impressive 2.06% CTR. Following behind were legal services (1.61%), retail (1.59%), apparel (1.24%), and beauty (1.16%). Meanwhile, industries like travel and tech often report lower numbers. These differences come down to things like buyer intent and how well different ad formats work for each audience. If you're running global campaigns, you can explore more global CTR statistics to see how you stack up.
To give you a clearer picture, here’s a quick breakdown of average Click-Through Rates across some key industries. This data helps marketers understand where they stand compared to their peers.
| Industry | Average CTR (%) |
|---|---|
| Legal | 1.61 |
| Retail | 1.59 |
| Apparel | 1.24 |
| Beauty | 1.16 |
| Technology | 1.04 |
| B2B | 0.78 |
| Finance & Insurance | 0.56 |
Remember, these numbers are just guideposts, not strict rules. Your own performance will always depend on your unique combination of creative, audience, and offer.
Let's break down what these benchmarks really mean for you.
Legal: It might be surprising, but legal services pull in a high CTR of 1.61%. A compelling offer popping up in a social feed can cut through the noise of crowded search results and grab attention.
Retail: With an average of 1.59%, retail brands have the advantage of showing off tangible products people want. Strong visuals and a clear "Shop Now" call-to-action drive fantastic engagement here.
Apparel & Beauty: These visual-first industries do consistently well, with CTRs of 1.24% and 1.16%. High-quality product shots and influencer-style content are a winning combination.
Technology: This sector sees a more moderate 1.04% CTR. The products are often more complex, so users need a bit more convincing before they decide to click.
B2B: At 0.78%, B2B advertisers are playing a different game. They’re focused on a super-specific audience, so while the click volume is lower, the quality of each click is often much, much higher.
Finance & Insurance: This is one of the toughest nuts to crack, with an average CTR of just 0.56%. Building trust and communicating value clearly is everything here.
By using these industry-specific numbers, you can stop guessing and start making informed decisions. If your CTR is way below your industry average, it’s a clear sign to start testing new creative or refining your audience. And if you're crushing the average? You know you’ve got a winning formula ready to scale.
Not all clicks are created equal, and your campaign objective is probably the single biggest factor in defining what a “good” CTR even means. A classic mistake advertisers make is applying one blanket benchmark across every campaign, which almost always leads to drawing the wrong conclusions about what's working.
Your chosen goal is a direct instruction to Facebook’s algorithm. It tells it what kind of user to find and which action to prioritize, completely changing the definition of success.
Think of it this way: a campaign optimized for Traffic is like a friendly greeter standing outside a store. Their only job is to get people through the door. The algorithm goes out and finds users who are known “clickers”—people who frequently click on ads, whether or not they ever buy anything. Since the barrier to action is incredibly low, these campaigns naturally pump out a much higher Facebook ad click-through rate.
On the flip side, a Conversions campaign is like a personal shopper who’s been told to find customers ready to buy right now. The algorithm intentionally ignores the casual window-shoppers and focuses on users whose past behavior signals they’re likely to purchase, sign up, or complete another high-value action. This pool of users is smaller and far more selective, which means you'll see fewer clicks—but the clicks you do get are infinitely more valuable to your bottom line.
This is where you have to get comfortable with the difference between high-volume and high-intent clicks. A massive CTR isn't always the prize you should be chasing.
A lower CTR on a conversion-focused ad can be way more profitable than a high, vanity-metric CTR from an awareness or traffic campaign. It’s a sign that you’re reaching the right people, even if that group is smaller.
It's a textbook case of quality over quantity. An e-commerce brand might get a 2.5% CTR on a Traffic campaign sending people to a new blog post, but only a 0.8% CTR on a Sales campaign promoting a specific product. While the first number looks way better on a spreadsheet, the second campaign is the one actually driving revenue. Judging the Sales campaign by the Traffic campaign's benchmark would be a huge analytical mistake.
Understanding how each objective is engineered helps you set realistic expectations for your click-through rates. Each goal is built for a different stage of the marketing funnel.
Awareness & Reach: These are top-of-funnel campaigns designed to get your ad in front of as many eyeballs as possible for the lowest cost. The main goal is impressions, not clicks. CTR is an afterthought here and will naturally be very low.
Traffic & Engagement: Sitting in the middle of the funnel, these campaigns are explicitly built to generate actions like clicks, likes, comments, and shares. Facebook will hunt for users who are likely to perform these actions, which is why these objectives tend to produce the highest CTRs of all.
Conversions & Sales: Down at the bottom of the funnel, these campaigns ask for the biggest commitment from a user. Because the end goal is a purchase or a lead, the algorithm prioritizes users with high purchase intent, not just high click intent. This leads to a more focused (and smaller) audience, often resulting in a lower CTR.
This split in performance shows up clearly in recent industry data. Campaigns optimized for traffic average a 1.57% CTR, which is well above the platform-wide average. Meanwhile, conversion campaigns—the go-to objective for about 27% of Facebook advertisers—often see lower CTRs because they’re busy filtering for users who are ready to act, not just browse. You can see more on these objective-based performance findings here.
By matching your CTR expectations to your campaign's actual goal, you can measure success more accurately and make smarter decisions. And if you're managing tons of campaigns with different objectives, a structured approach can be a lifesaver. Our guide on how to batch create Facebook campaigns can help you set up and test all these different objectives way more efficiently.
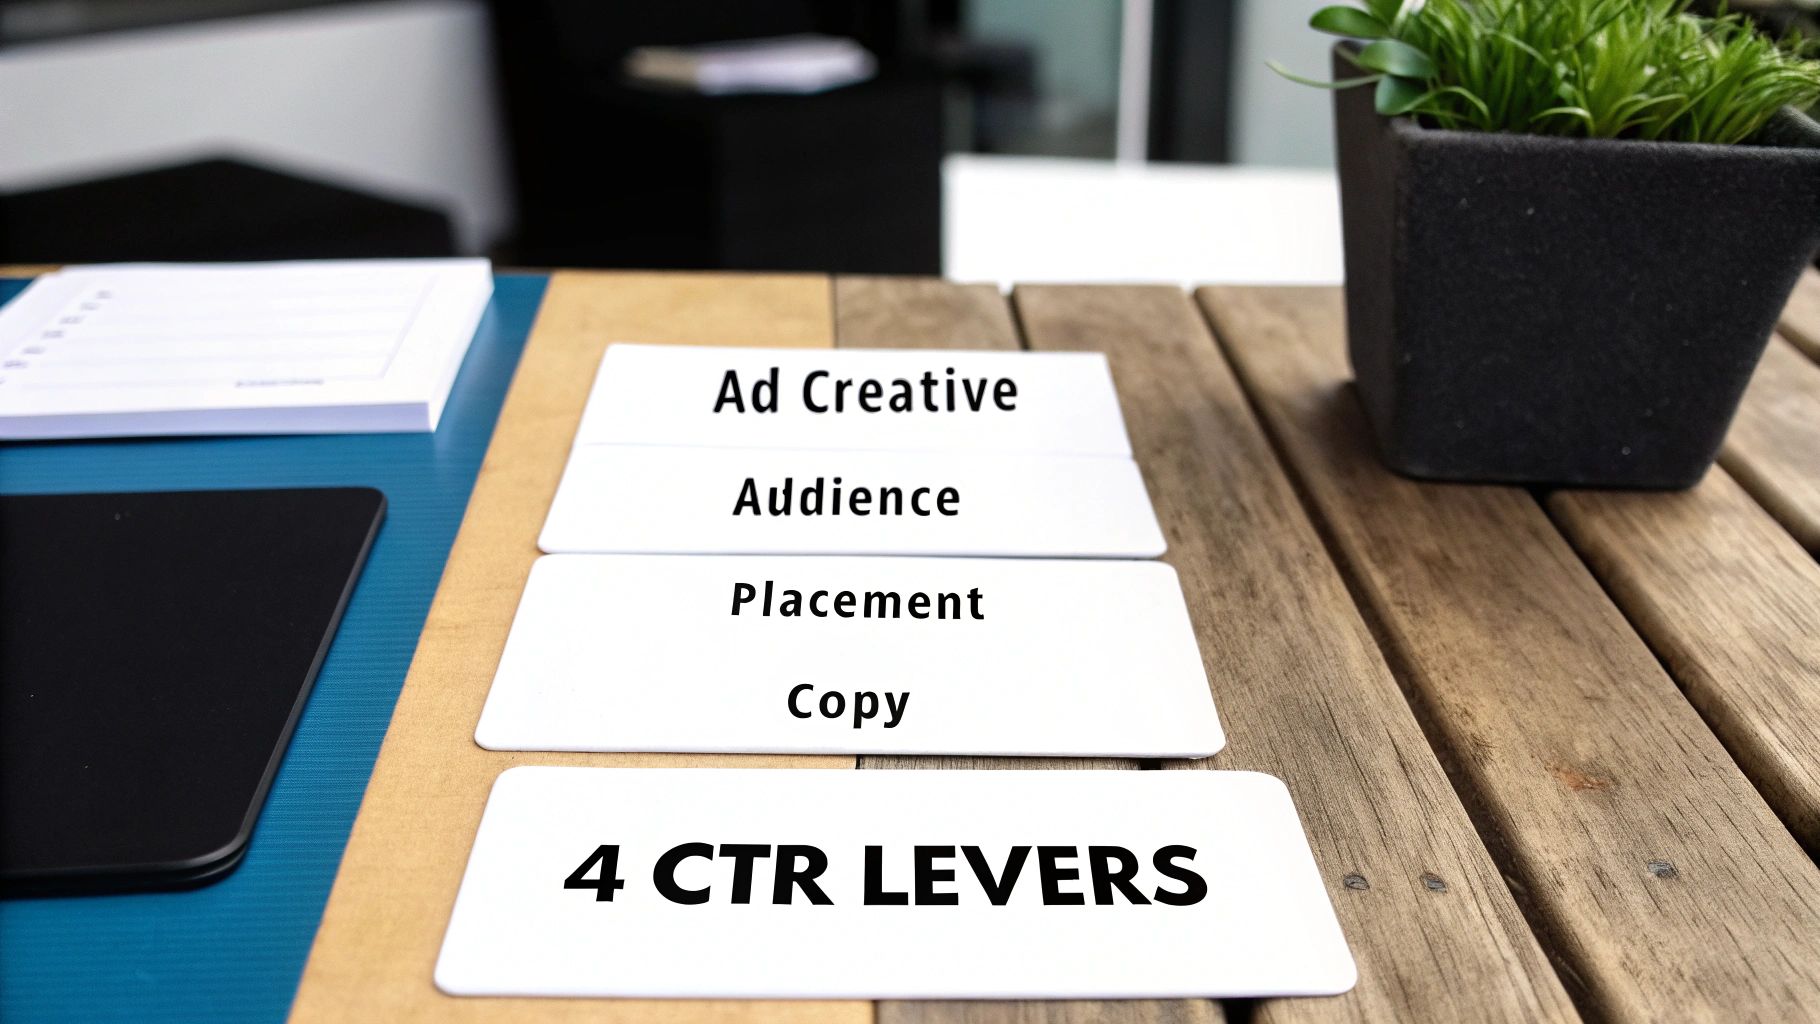
Knowing the benchmarks is a great start, but actively influencing your click-through rate is where you start to win. Don't think of your CTR as some fixed number handed down by the Facebook gods. It's the direct result of four key inputs you control.
By pulling these "levers," you can diagnose exactly what’s holding you back and start driving much better performance. These four elements work together to either grab someone's attention or get completely ignored in a noisy feed. Getting them right is how you go from knowing the average Facebook ad click-through rate to consistently beating it.
Let's break each one down.
This is the big one. The creative is the heart and soul of your ad—it’s the image, video, or carousel that has to stop a thumb from scrolling in a split second. No amount of genius targeting can rescue a boring or confusing visual.
On a platform as visual as Facebook, your creative is your first handshake. It has to be a firm one.
Here’s what really moves the needle:
Your ad creative is your single biggest opportunity for a quick win. Swapping a generic stock photo for a compelling customer video can sometimes double your CTR overnight. It’s that powerful.
Who sees your ad is just as crucial as what the ad looks like. You could design the most beautiful, compelling ad in history, but if you show it to the wrong people, your CTR will be stuck at zero. This lever is all about precision.
Facebook's targeting tools are incredibly powerful, letting you go from giant, broad audiences to tiny, hyper-specific groups of people ready to buy. The more relevant the ad feels to the person seeing it, the more likely they are to click.
Think about the "temperature" of your audience:
A classic rookie mistake is showing the exact same ad to both cold and warm audiences. Someone who knows your brand might respond to a direct "20% Off" offer, while a complete stranger needs a bit more of an introduction first.
Placement is simply where your ad shows up across Meta’s universe. An ad in the Facebook Feed is a totally different beast from one in Instagram Stories or Messenger. Each placement has its own user behavior and creative rules.
For instance, someone scrolling their Facebook Feed is often in a relaxed, "lean-back" mode. A more detailed carousel ad or a longer-form video can work well there.
Contrast that with someone tapping through Instagram Stories. They're in a rapid-fire, "lean-forward" mode. You need a vertical, full-screen creative with big, bold text that gets the message across in seconds. Running a square, text-heavy ad in a Stories placement is a guaranteed way to tank your CTR.
Using Automatic Placements is fine to start, but you absolutely must check your performance breakdown by placement. You'll quickly find that one or two spots are driving most of your results, letting you focus your budget where it really counts.
Finally, your words. The creative grabs their eye, but the copy—your headline, primary text, and call-to-action (CTA)—gives them the reason to click. It provides the context and the motivation.
Great ad copy is clear, concise, and focused on benefits. It quickly answers the user's silent question: "What's in it for me?"
Systematically testing these four levers is the core job of a media buyer. By isolating and improving each piece, you build a powerful machine for consistently driving high-quality clicks. For a deeper look at optimizing your visuals, check out our guide on Facebook Ads creative management best practices.

Knowing the benchmarks and what influences them is one thing. Putting that knowledge into practice is what actually drives results. Moving beyond the average Facebook ad click-through rate isn't about guesswork; it’s about having a systematic approach to testing and optimization. This is where we shift from diagnosing problems to actively building ads that people want to click.
The following strategies are repeatable, data-backed tactics you can use to lift your CTR. These aren't just generic tips—they're the foundational practices top-tier advertisers use to make sure their creative and targeting hit the mark every single time.
Guesswork is the arch-nemesis of a great CTR. Instead of running on gut feelings, you need to let your audience tell you exactly what they want to see. The best way to do that? Rigorous A/B testing, also known as split testing. The process is simple: create multiple versions of an ad, change just one thing at a time, and see which one performs better.
A disciplined testing framework is the fastest way to learn what drives clicks. If you test too many variables at once, you’ll be left wondering which change actually moved the needle. Isolate your tests, and you'll get clean, actionable data you can build on.
Here are the most impactful elements to start testing:
For a deep dive into structuring these experiments for rock-solid results, check out our guide on Facebook Ads A/B testing at scale. It gives you a complete framework.
Running dozens of individual A/B tests can quickly become a full-time job. That's where Facebook’s Dynamic Creative feature becomes a total game-changer, automating a huge chunk of the testing process for you.
You just feed the machine a collection of your creative assets—multiple headlines, images, videos, descriptions, and calls-to-action. Facebook’s algorithm then gets to work, mixing and matching these components in real-time to create tons of ad variations on the fly. It then automatically figures out which combinations perform best and serves those to different segments of your audience.
Dynamic Creative is like having an AI-powered media buyer working for you 24/7. It uncovers the winning ad combinations faster than you ever could manually, accelerating your journey to a higher CTR.
This is especially powerful for e-commerce. You could upload five different product shots, three headlines highlighting different benefits, and two CTAs ("Shop Now" vs. "Get 20% Off"). The algorithm might discover that one specific image paired with the discount-focused CTA delivers the best click-through rate, saving you weeks of manual testing.
Boosting your CTR isn’t just about making a better ad; it’s about showing it to the right people. Sharpening your audience targeting ensures your message is hyper-relevant, which naturally leads to more clicks. Your ad could be perfect, but if the wrong audience sees it, it will fall flat.
Start with these powerful refinement tactics:
For example, an e-commerce brand noticed its CTR was tanking. Their "Learn More" call-to-action was just too vague for their visually-driven products. By A/B testing it against "Shop The Look," they created a prompt that was more direct and aspirational. That one small change increased their CTR by 40% because it perfectly aligned the user's expectation with the ad's intent, leading to more qualified, motivated clicks.
Once you start getting your hands dirty with Facebook ads, the same questions tend to surface over and over. This final section cuts through the noise and tackles the most common sticking points and myths about click-through rates.
Think of it as the quick-reference guide I wish I had when I first started.
Absolutely not. It's one of the biggest rookie mistakes to chase a high CTR just for the sake of it. While seeing a big number feels great, it can easily become a vanity metric if those clicks aren't actually helping your business.
A high CTR simply means your ad was catchy enough to grab attention and earn a click. It says nothing about the quality or intent behind that tap.
Imagine running an ad with a clickbait headline like, "This One Trick Will Change Your Life..." You might get an incredible 3% CTR from sheer curiosity. But if 99% of those people land on your page, realize it's not what they expected, and leave immediately, what have you accomplished? You just paid for a lot of expensive, useless traffic.
The goal isn't just getting clicks; it's getting the right clicks from people who will actually convert. A campaign with a lower 0.8% CTR that drives real sales is infinitely more valuable than a flashy campaign with a high CTR and zero revenue. Always, always look at your CTR next to your conversion rates and ROAS.
Patience is a superpower in digital marketing. Calling an ad a failure too soon is a classic, costly error. You have to give an ad enough time to get out of Facebook's "learning phase" and collect enough data to be meaningful.
A solid rule of thumb is to wait until an ad has at least 1,000 impressions. For most ad sets, this gives the algorithm enough data to smooth out the initial volatility and show you a CTR that's actually stable and reliable. If you check your stats after just a few hours, the numbers will swing wildly and tell you nothing useful.
Give your ads a bare minimum of 24 to 72 hours before you even start to form an opinion on their performance.
Never, ever analyze your CTR in a vacuum. It's just one dial on a much larger dashboard. To get the complete story of your ad's health, you need to see how it interacts with a few other key performance indicators (KPIs).
Here are the essential metrics to pair with your CTR analysis:
Looking at these numbers together is what separates amateurs from pros. It shifts your focus from just measuring clicks to truly understanding their impact on your business, which is the key to making smart decisions about what to scale and what to kill.
Ready to stop wasting time on manual campaign setups and start testing creatives faster? Lix.so lets you launch entire Facebook ad campaigns in seconds, not hours. Upload creatives in bulk, reuse your best-performing campaign structures with templates, and get back to focusing on strategy. Start your 7-day free trial and see how much faster you can move.
Create hundreds of Facebook Ads campaigns in minutes with Lix.so. Batch creative upload, reusable templates, and automatic campaign generation.
✓ Free for 14 days · ✓ No credit card required · ✓ Cancel anytime